If you enjoy this review and decide to grab the deal, please consider clicking through one of my links before you buy. I earn a small commission at no cost to you, which helps support this site and keep the reviews coming. Thanks!
You spend weeks or even months working on a track, mix it, master it, then excitedly upload it to the various streaming platforms. When you play it back, however, something just isn’t right – it doesn’t sound the same as other songs on the platform, and is too loud and distorting, or too “squished” by the platform’s normalization and compression algorithms. In many cases, the loudness of your uploaded track is the issue. Today we’re going to take a look at one solution to the loudness issue, Youlean Loudness Meter, review the features of both the Free and Pro versions, and decide which is the best for you.
Looks
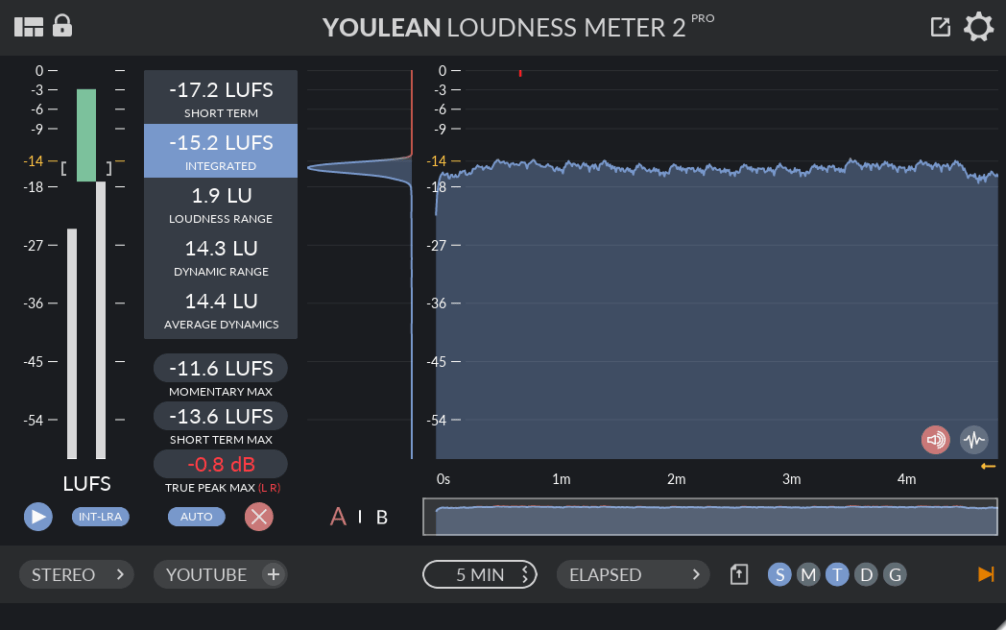
Youlean Loudness Meter opens to a black and white screen with gray and blue meter boxes and a large histogram graph. On the left is a vertical meter that shows a ton of different measurements, including short term, integrated, momentary max and short term max LUFS, loudness and dynamic range, average dynamics, and true peak. On the right is the LUFS graph that fills in blue and red as you playback your track – blue is below the current LUFS ceiling, and red is above. Above the LUFS graph are red tick marks that show when the True Peak goes near or into clipping.
In the top left corner is a visual settings menu, and in the top right are export and settings menus. Along the bottom are mono/stereo/surround options, loudness presets, A/B toggle, visual scaling and time display options, additional quick toggles for the graphs, and file open function for quick analyzing files that are not in the DAW environment. There is a huge breadth of control over all the visual features, which is greatly appreciated in a metering plugin, and all the controls are logically placed within the attractive interface.

Features
Upon first opening Youlean Loudness Meter one may be a little overwhelmed by all of the numbers, graphs, and options. Let’s take a look at each one in detail. (For a step-by-step tutorial on how to use the plugin and a lot more information about loudness metering and what all the various measurements mean, check out my article How To Use Youlean Loudness Meter.)
Meters and Graphs
Loudness Meter
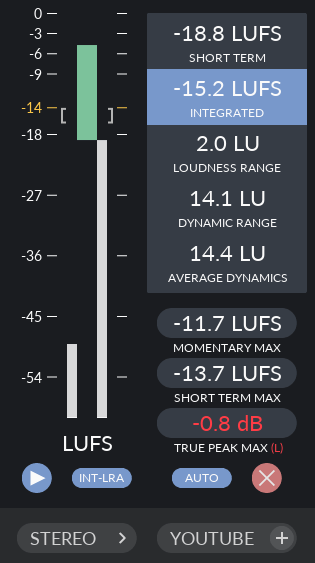
The Loudness Meter display gives you at-a-glance visuals of all of the raw numbers, including colors to help you identify trouble areas. This meter is great for real-time updates on what is happening with the overall loudness of your track so you can make adjustments accordingly.
Loudness Histogram
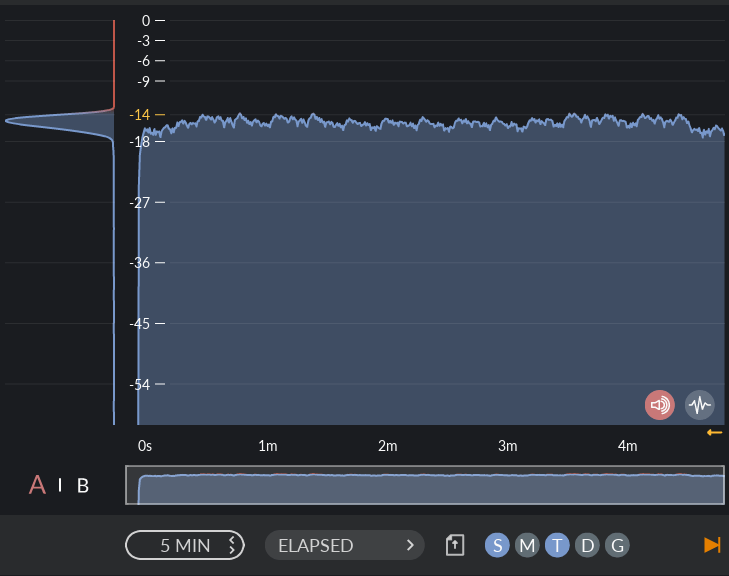
Building on the visual functionality, the histogram graph shows a record of the loudness over time. You can change the length of time displayed and add or remove several datapoints from the graph to tailor the view to your needs. There is also a Distribution graph (far left of the picture above) that shows the entire breadth of loudness for the entire track.
Dynamics Histogram
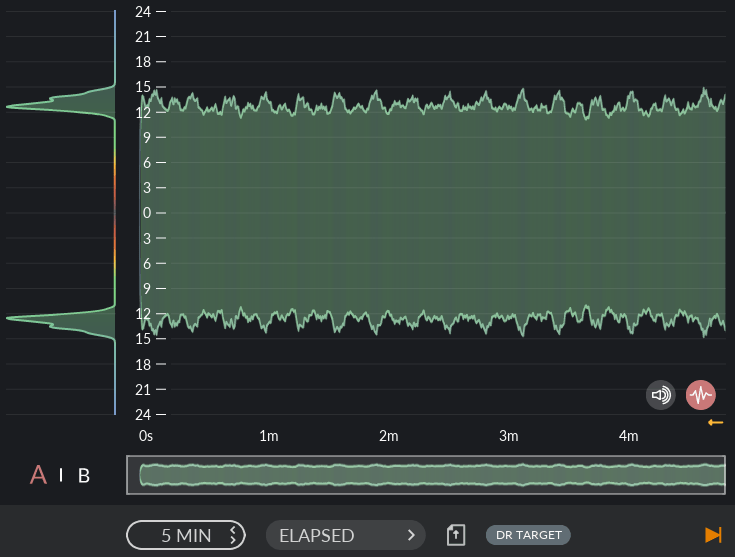
The Dynamics histogram is a graph available in the Pro version that displays the dynamic range of your entire track in a stereo field, and also includes a Distribution graph similar to the LUFS histogram. If your track has a ton of stereo panning, this display is great for making sure that the overall loudness isn’t overpowering on one channel versus the other.
Visual Options
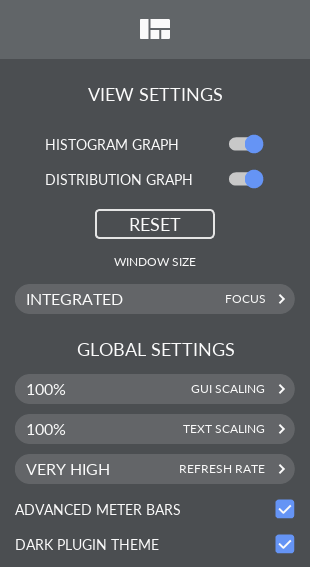
Youlean Loudness Meter has an bunch of visual customization features, especially in the Pro version. The histogram and distribution graphs can each be toggled on and off, GUI and text can be resized, and the overall graph refresh rate can be customized. Also, within the settings menu, each of the threshold and scaling options on the graphs as well as the alerts can be individually set, including the color scales on the Dynamics histogram. The Pro version also has a nifty dark mode (which, as we all know, is always better).
Graph Export
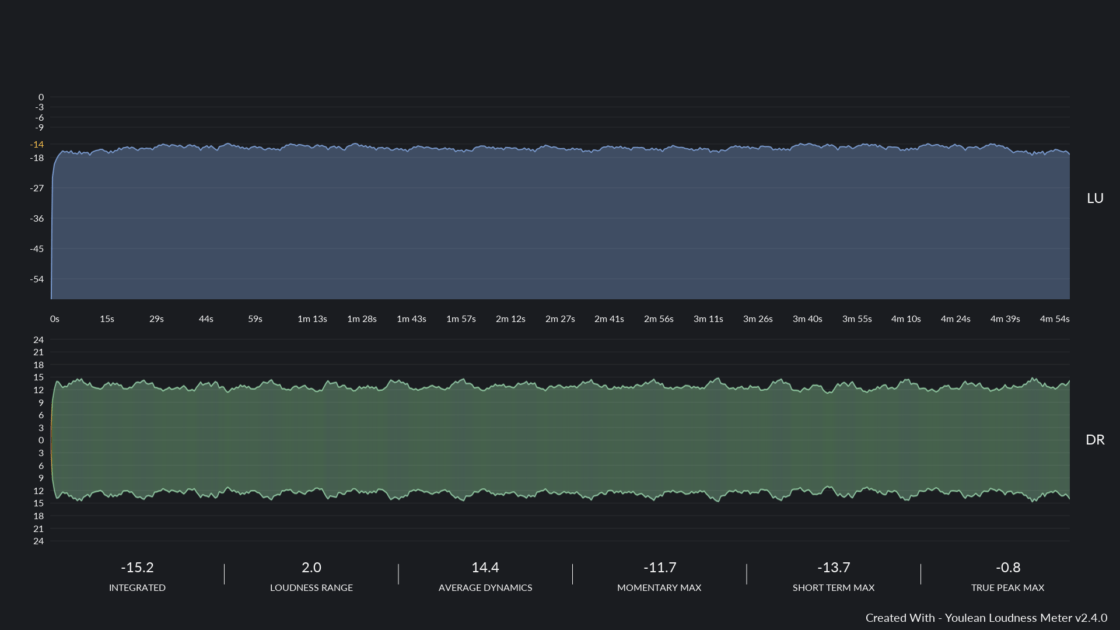
The graph export feature is absolutely invaluable for any mastering engineer who regularly works with multiple clients. The ability to export a graph to send to clients along with their master to show their track’s overall loudness will quickly stop some of the annoying back-and-forth with pickier clients who want their track to ‘slap.’ This feature is also useful for getting a ‘big picture’ overview of your tracks to gain a sense of how dynamic it is overall.
Free vs. Pro
Here’s what comes in the Free version of Youlean Loudness Meter:
- Loudness and True Peak Metering and Histogram and Distribution Graphs
- Real-Time display of all track metrics
- Mono, Stereo, and Surround options
- Basic GUI functions (resizing, scaling)
- Presets for film, TV, and gaming platforms
The Pro version includes all of the Free features, plus:
- Dynamics Histogram and Distribution Graphs
- Export Function to save Graphs to PDF, PNG, or SVG
- Presets for Streaming platforms and ability to save custom presets
- Advanced GUI functions
- A/B Function
- Drag-and-drop file analysis
Also, unlike a lot of plugins on the market, a Pro license of Youlean Loudness Meter comes with lifetime updates, so when versions 3 and beyond are released, you’ll get the updated version for free.

Usability
The interface in Youlean Loudness Meter is incredibly intuitive. The graphs take full advantage of the preattentive visual properties of color and size, making it easy to tell when your track is clipping or exceeding loudness and in need of additional adjustment to pass muster. The additional dynamics graph in the Pro version also provides an easy visual reference as to the dynamic range of your tracks and helps prevent overcompressing. The huge amount of control over the graphs make Youlean Loudness Meter useful for lots of different applications, and the drag-and-drop file analyzing feature in Pro is indispensable for producers that work with tons of samples or engineers that work with numerous clients and platforms.
When I was using Youlean Loudness Meter, there were several times that I wanted to go back and undo changes to settings that I had just made, particularly in the Dynamics graph visual settings, but was unable due to a lack of undo/redo function buttons. I don’t feel this is worth taking points off of the overall usability score, but more of a possibility for an added feature in a future version of the plugin.

Youlean Loudness Meter Review – The Bottom Line
Youlean Loudness Meter is unparalleled in terms of value. The Free version of the plugin is fully functional as a LUFS meter, and for less than $50 the Pro version adds a ton of extra presets, drag-and-drop functionality, and myriad visual options. All that additional functionality makes the Pro a solid investment for mastering engineers, studio owners, or anyone regularly uploading their finished tracks to numerous platforms.

I picked up Youlean Loudness Meter a few months ago because I wanted a quick, easy solution for setting loudness while mastering a track for publishing on Facebook. Since then it has made an appearance on every master I’ve done. The breadth of metering available in this plugin, especially the Pro version, has made Youlean Loudness Meter an essential part of my workflow. To me, calling Youlean Loudness Meter anything but a 5-star product would be a travesty. If you don’t have it, my recommendation is to go get it (at least the Free version), learn how to use it, and strongly consider upgrading to Pro for lifetime updates.

Loudness metering (LUFS and True Peak) with histogram and distribution graphs, export function and drag-and-drop analysis. Presets for dialing in the perfect loudness for your tracks.

